Product
Segment your data from the scatter plot and inspect individual objects with new object views

2023/06/21 | 4 min read
One of the biggest challenges teams face when curating data for computer vision is assessing whether the data they’ve selected, regardless if done by hand, random sampling, or using an automated approach like auto-curation, is suitable for model training or validation. This is primarily based on the diversity of objects selected, the inclusion of enough rare or unusual objects, and the presence (or lack thereof) of mislabeled instances.
This month, we've released several key updates for Superb Curate that turn your scatter plot of image and object embeddings from “cool” to ‘must have,’ including the ability to query and slice on scatter view, see scatter views from queries and slices, and more. We’ve also added the ability to inspect your data on an object-by-object basis, with new views and functionality within the grid and scatter tabs.
Read on to learn more about the newest features and capabilities in Superb Curate.
Easily explore and segment your data with the scatter plot

Scatter plots, based on clustered data, are valuable tools to understand data distribution at a glance, identify insufficient data to collect, and explore potential edge cases to improve your datasets. However, until now, they’ve only served as sources of information, meaning scatter view was only available on the entire dataset-level, and no direct interaction with the plot was possible. With this release, we’ve added several tasks you can perform directly on the scatter plot at both the image and object levels, allowing you to drill down and segment your data much more effectively.
- Query your data directly on the scatter plot
- Create slices from chosen data, including sampled data and the data corresponding to that region
- See scatter plots of your slice or query results
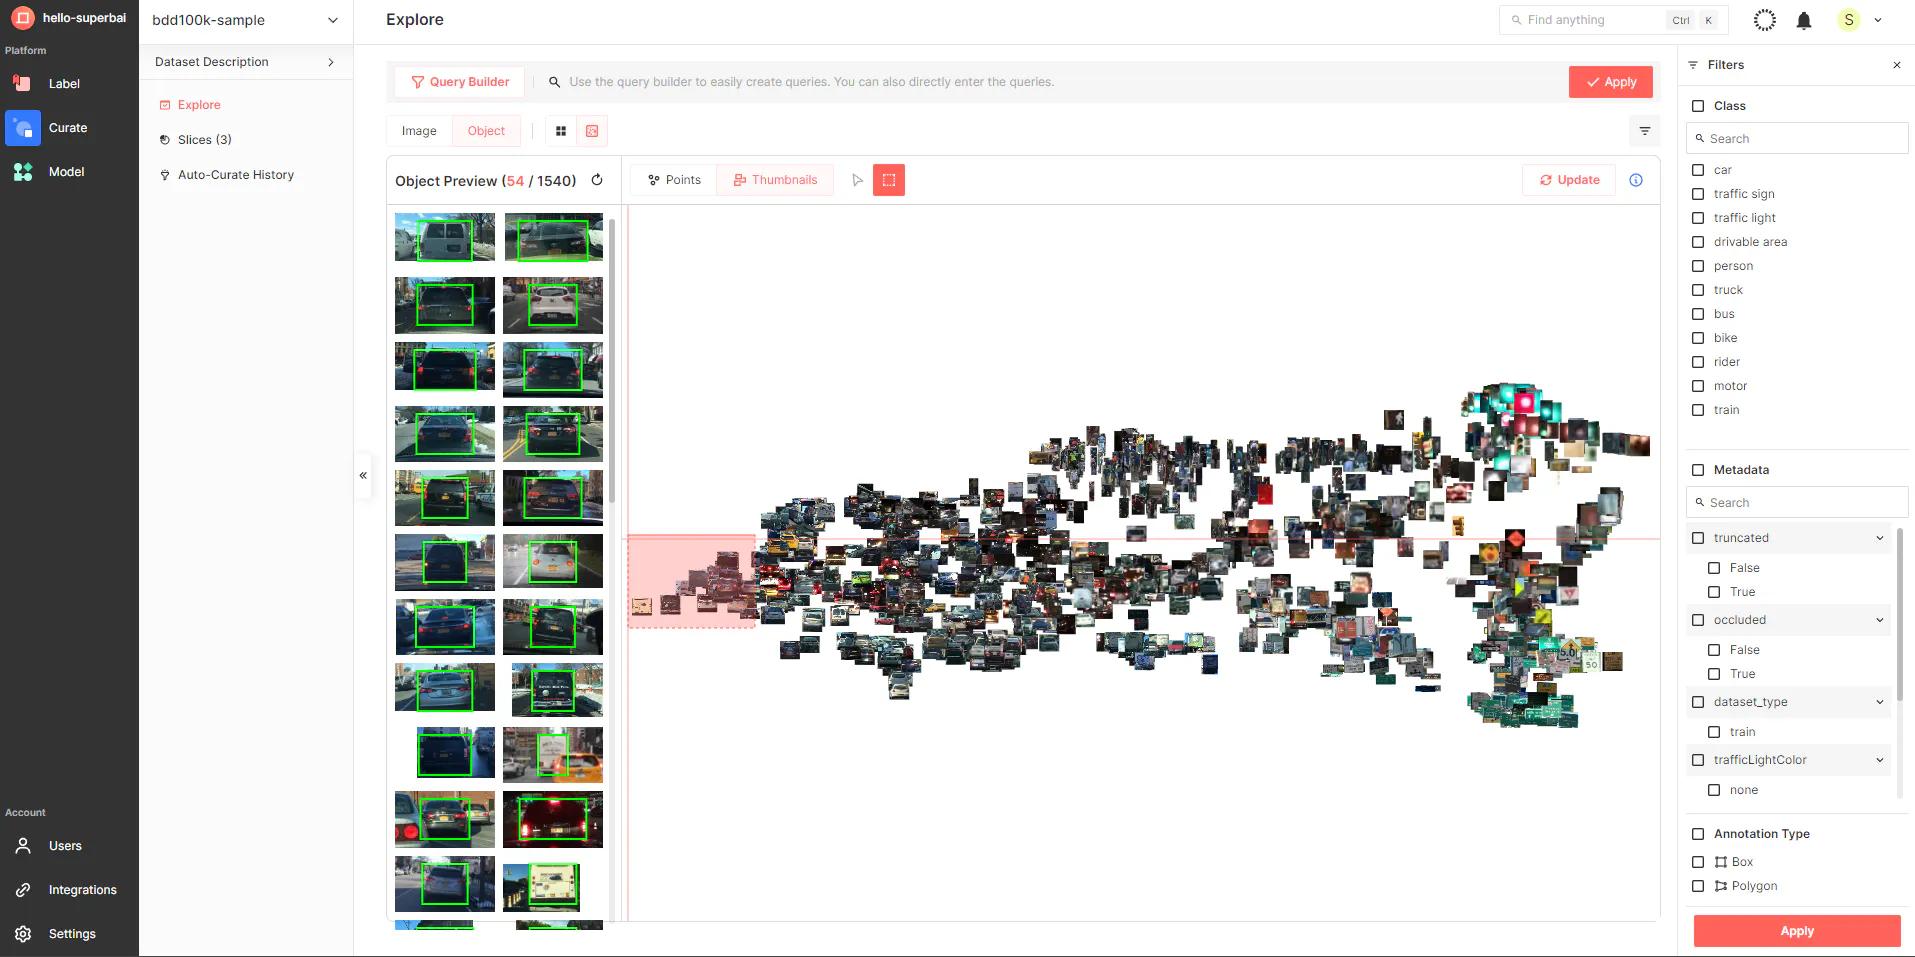
- Toggle between points and thumbnails on the scatter plot
When working on the scatter plot, and in general when curating data, it’s crucial to fully understand how your data is distributed in relation to the rest of the dataset. For this, we’ve added the ability to:
- Compare query results with a specific slice or your entire dataset
- Compare the data contained in your slice to your full dataset
Use new object-level grid and scatter views to inspect your data
Before this release, teams could only inspect and query data at the image level. With the addition of object-level views, teams can now quickly determine the exact location of objects of interest within images, see at a glance what features they possess, understand how they are clustered, and more.
Object-Based Queries
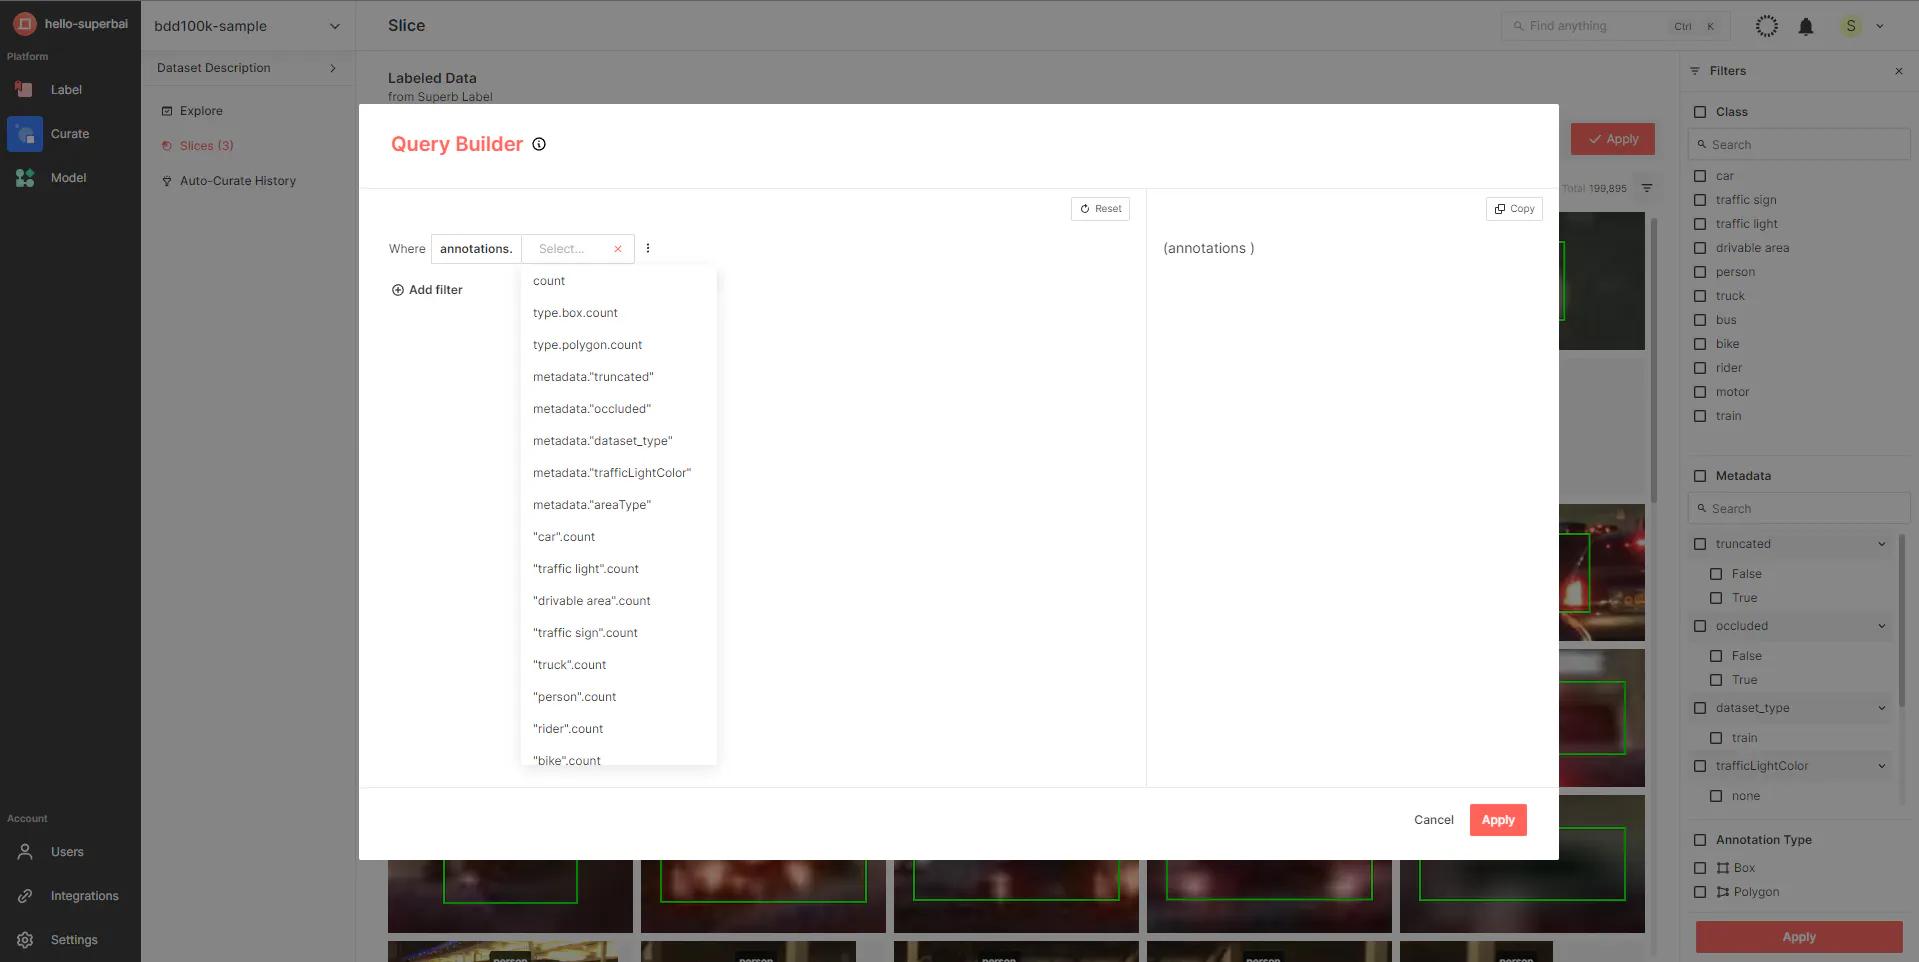
Rather than sifting through all your images to find objects that match specific conditions, you can now query and filter at the object level using a wide range of search operators. The results are shown as cropped annotations, shown on an object-by-object basis. This new object-based query feature is accessible through all views (grid and scatter).
Grid View

New in the grid view is a tab for objects, which shows every individually labeled object in a cropped format. From this view, teams can apply object-level filters to quickly and easily find the objects needed, including:
- Object classes, such as ‘car’ or ‘person’
- Annotation Metadata, such as ‘occlusion’ or ‘truncation’
- Annotation type, such as only showing ‘bounding boxes’
These filters can be combined with queries, allowing you to drill down as deep into your dataset as needed - making it easier than ever to find that ‘needle in the haystack.’
Scatter View
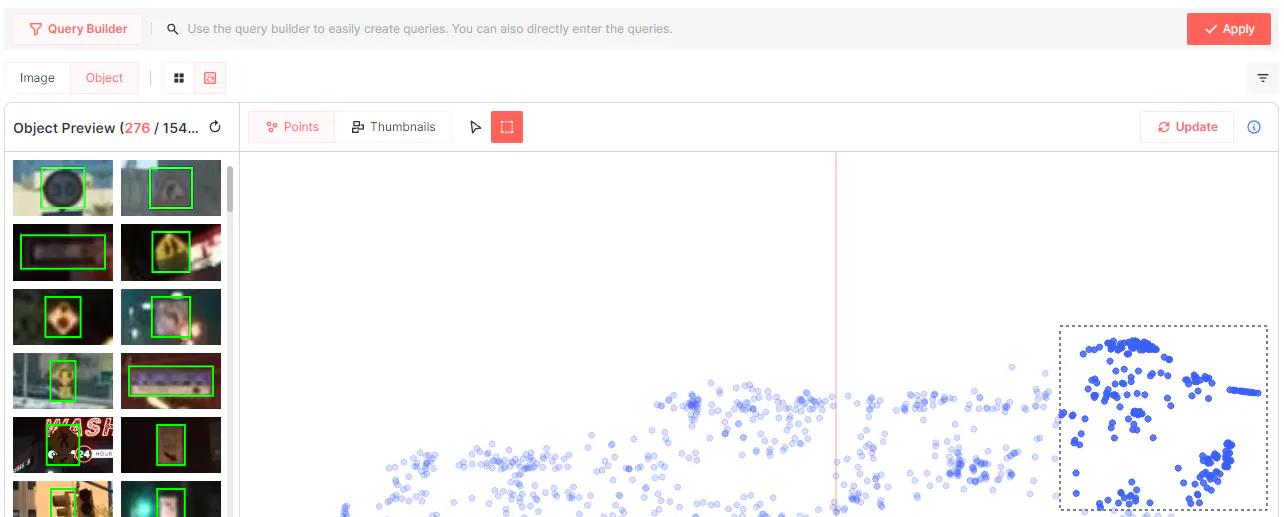
The scatter now allows teams to view the distribution of their dataset on an object-by-object basis. New scatter plot features like querying and slicing are also supported on the object-level scatter view.
What’s next for Curate?
Imagine the hours you’ve invested into meticulously labeling and curating your data, albeit a lot fewer using tools like custom auto-label and auto-curation. Picture the triumphant feeling you get when you export that data to train or validate your model and, finally, witness its success in action as a prototype or even in production.
But, as the fog of victory fades, the question persists - “How can I fine-tune my model further,” or “How can I fix lingering data issues like mislabels and biases?” Traditionally, the next steps have involved a near-endless cycle of trial and error.
However, we’re working to eliminate these headache-inducing trials. Soon, you’ll be able to evaluate the performance and vulnerability of your models in a fully data-centric manner through model diagnostics.
This upcoming release will provide everything you need to understand what types of data your trained model performs well or poorly on and what action you should take to fix or improve it. It will also include ways to compare and contrast the performance of different models trained on the same data (or even two versions of the same model).
Be on the lookout for more information on this next month!
Learn more about Curate
- How Curate and Auto-Curate work using the MNIST dataset as an example
- How Auto-Curate can save labeling resources (experimental study using MS COCO)
- How to improve model performance using Auto-Curate (LOCO experiment)
- A practical guide to feature embeddings for ML Engineers
- How to leverage computer vision data labeling through embeddings
Related Posts

Product
How to Build & Deploy an Industrial Defect Detection Model for a Lucid Vision Labs Camera

Sam Mardirosian
Solutions Engineer | 15 min read

Product
How to Build & Deploy a Safety & Security Monitoring AI Model for an RTSP CCTV Camera

Sam Mardirosian
Solutions Engineer | 15 min read
Product
How to Use Generative AI to Properly and Effectively Augment Datasets for Better Model Performance

Tyler McKean
Head of Customer Success | 10 min read

About Superb AI
Superb AI is an enterprise-level training data platform that is reinventing the way ML teams manage and deliver training data within organizations. Launched in 2018, the Superb AI Suite provides a unique blend of automation, collaboration and plug-and-play modularity, helping teams drastically reduce the time it takes to prepare high quality training datasets. If you want to experience the transformation, sign up for free today.
