Model Diagnosis metrics and their applications
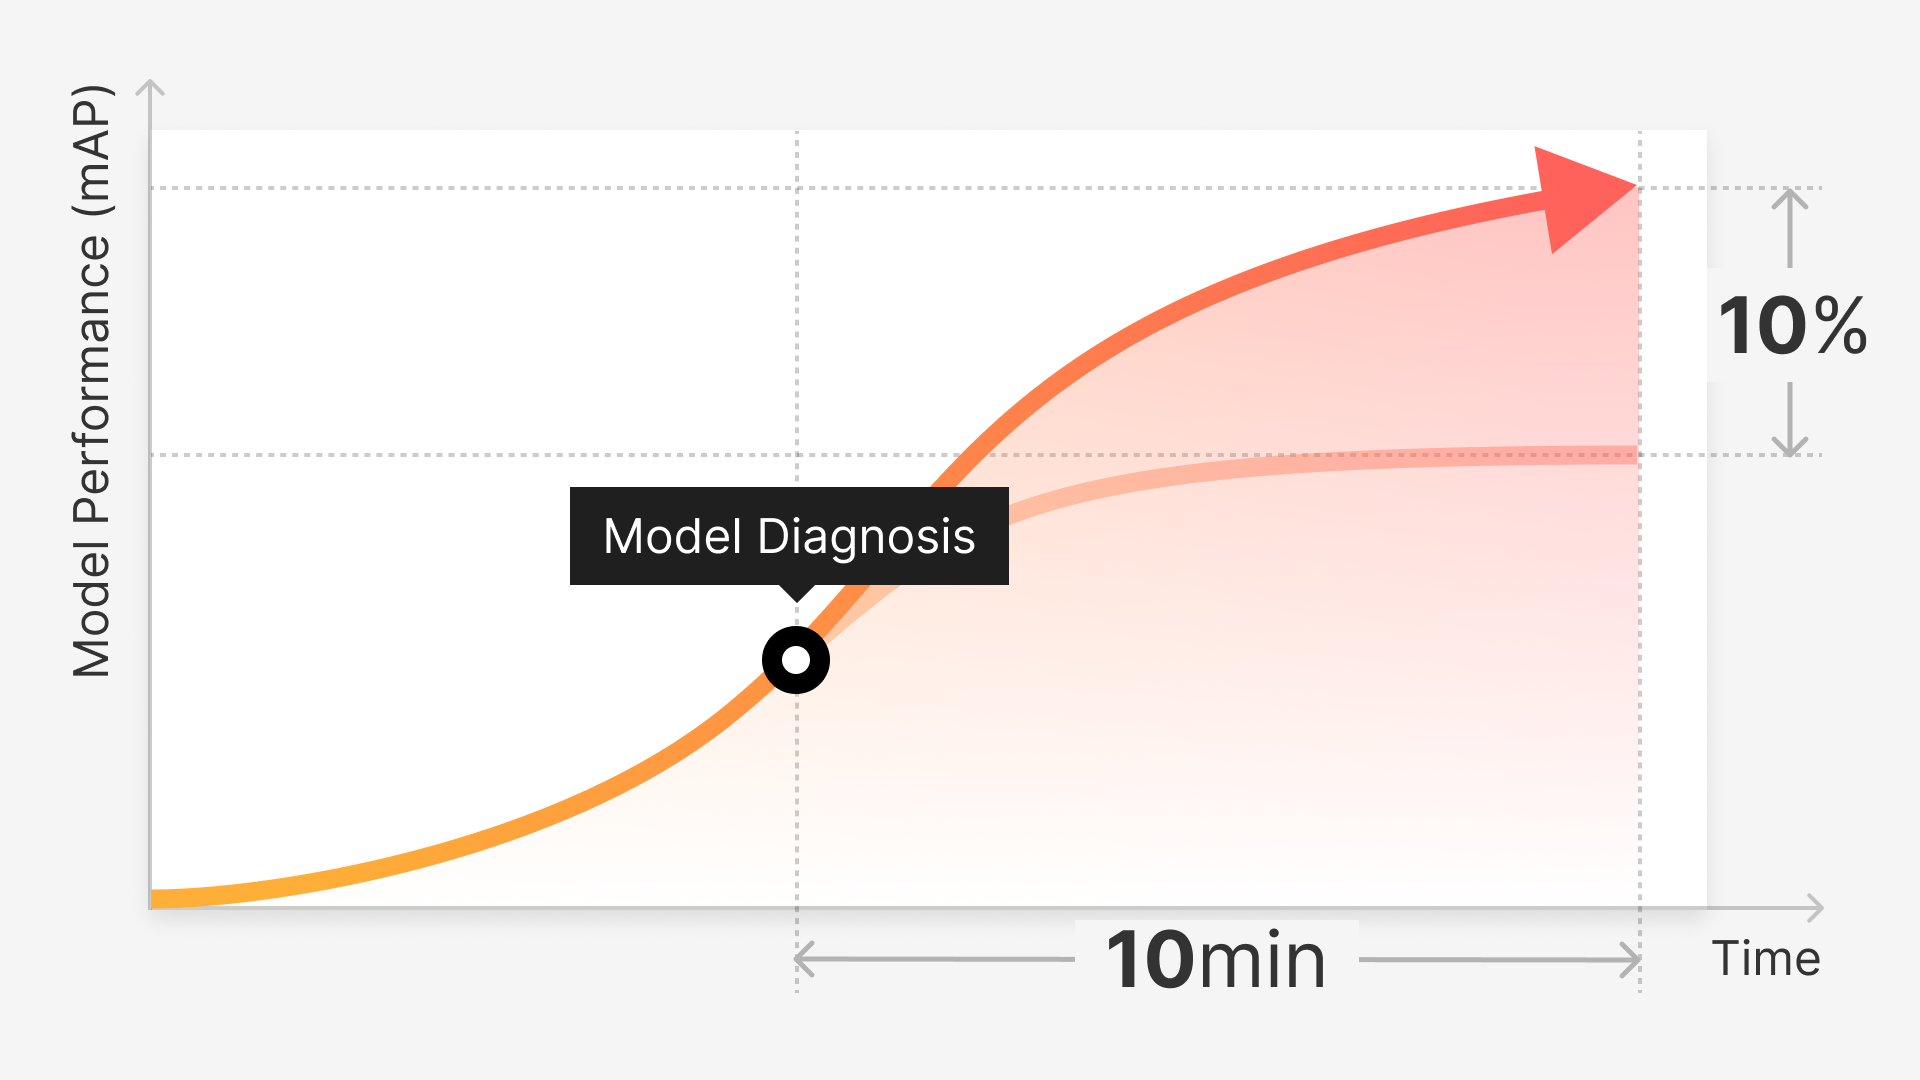
Model Diagnosis metrics are crucial when trying to understand and compare the performance of models. These insights will also help teams choose the right approach when fine-tuning these models. It's critical to select metrics that align with the model's characteristics and objectives, considering the nature of the problem and the desired outcomes.
Metrics used for model diagnosis
The metrics provided by Superb Curate (for performance assessment) include:
Confusion Matrix:
The Confusion Matrix is a fundamental tool for evaluating model performance. It features a tabular layout where one axis represents Ground Truth classes and the other represents model-predicted classes.
This matrix juxtaposes Ground Truth values against model predictions on a validation set, populating the table with the corresponding numbers.
For example:
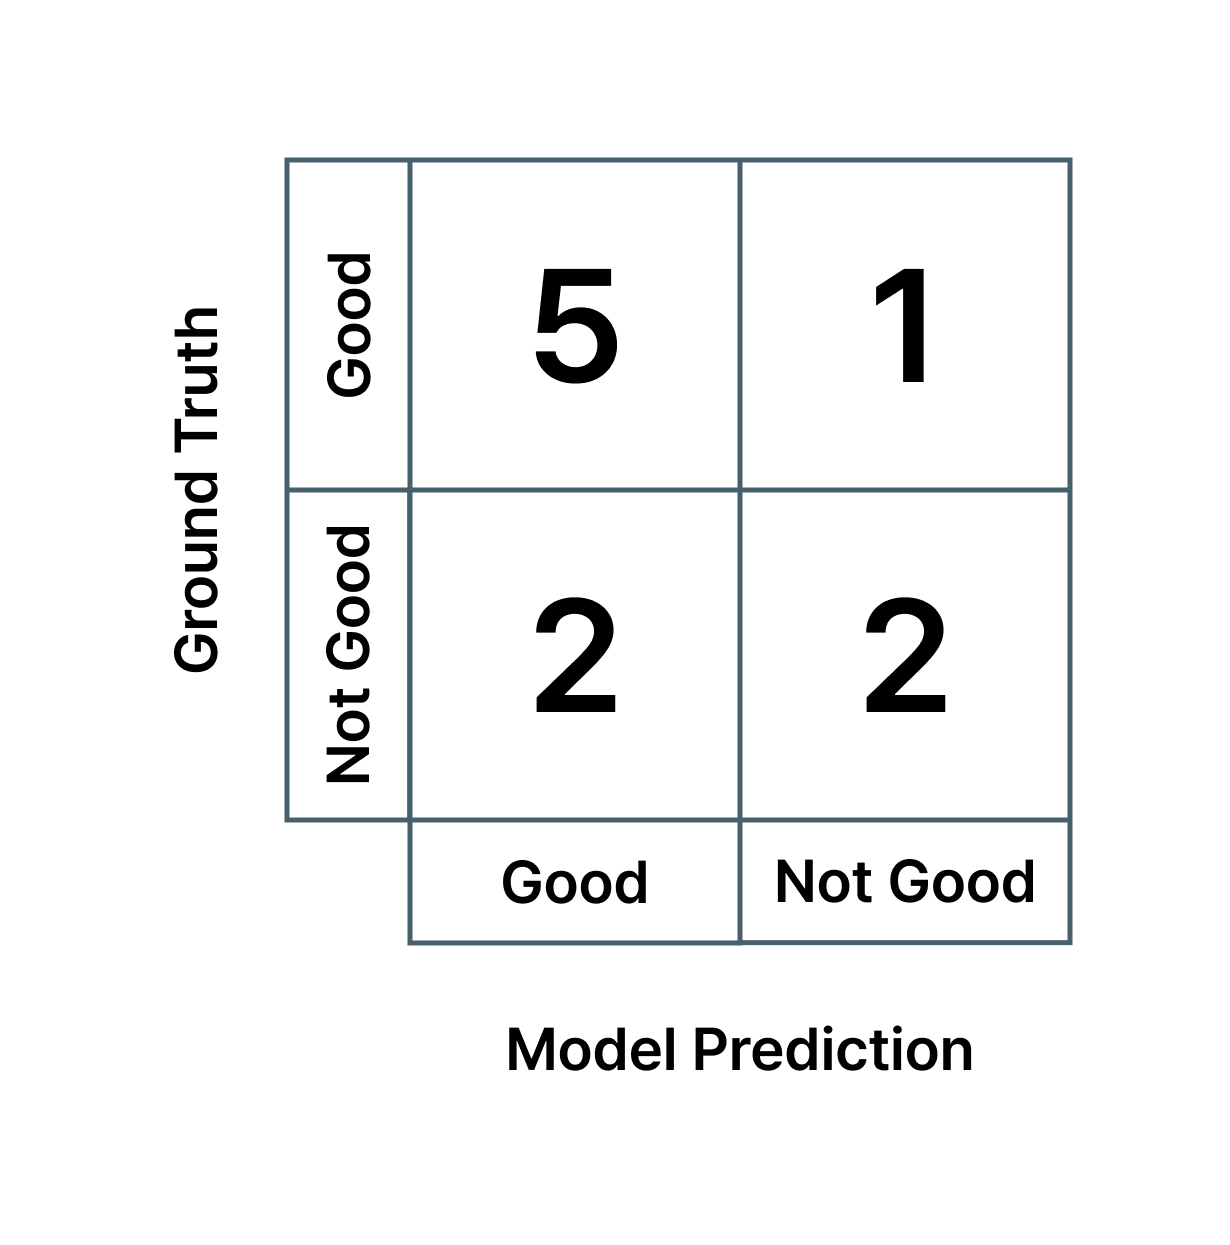
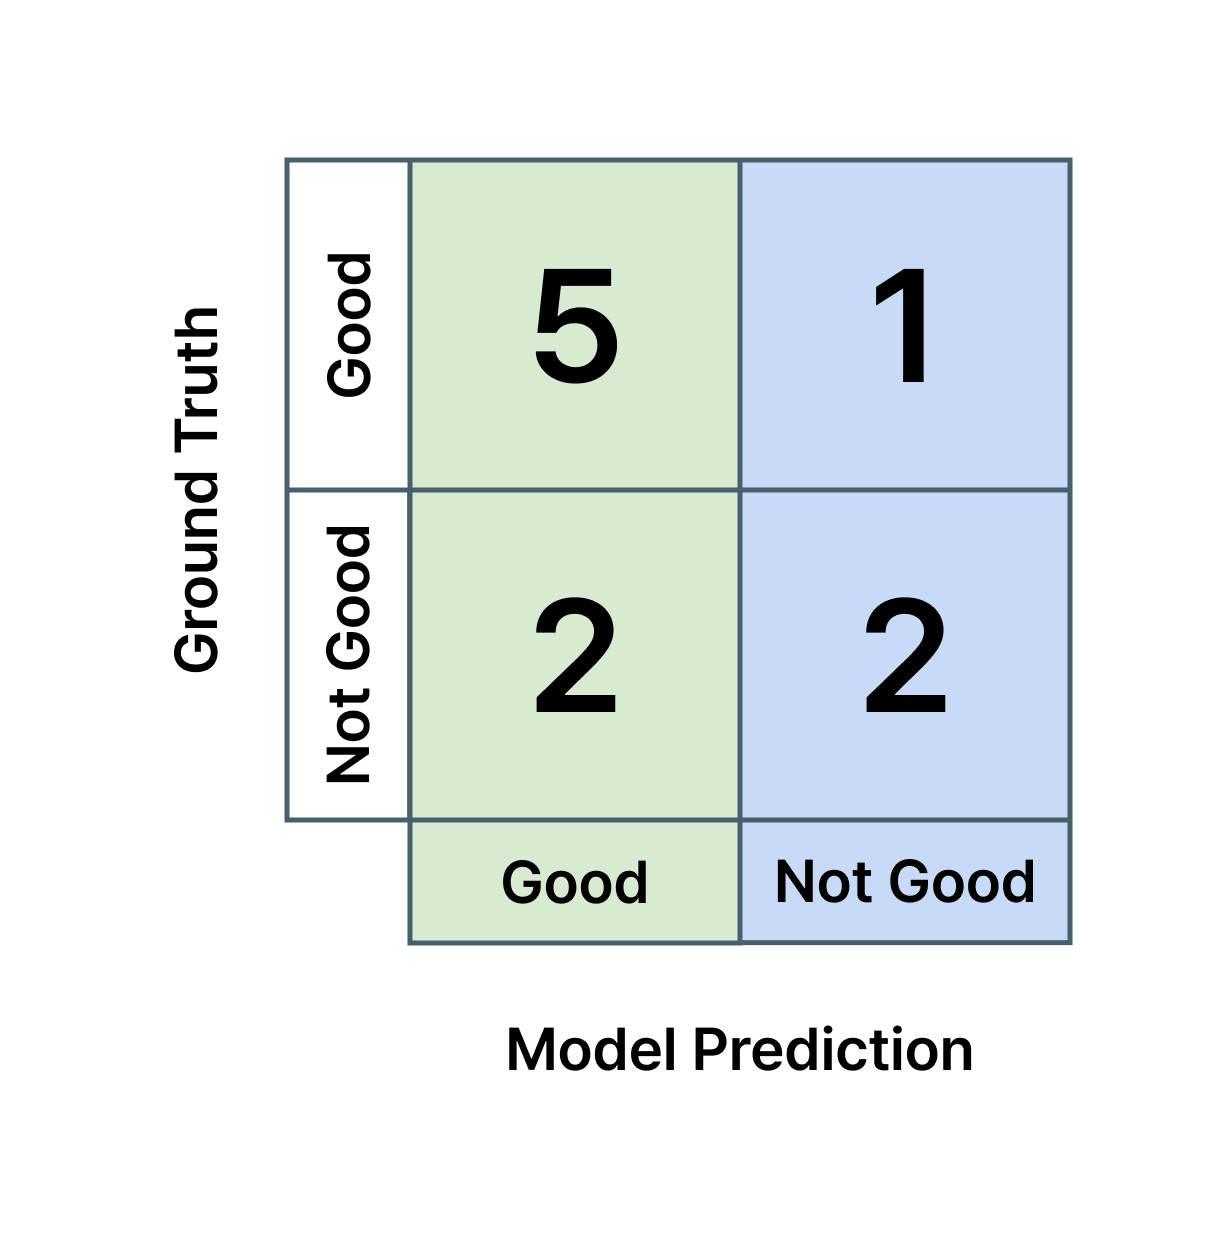
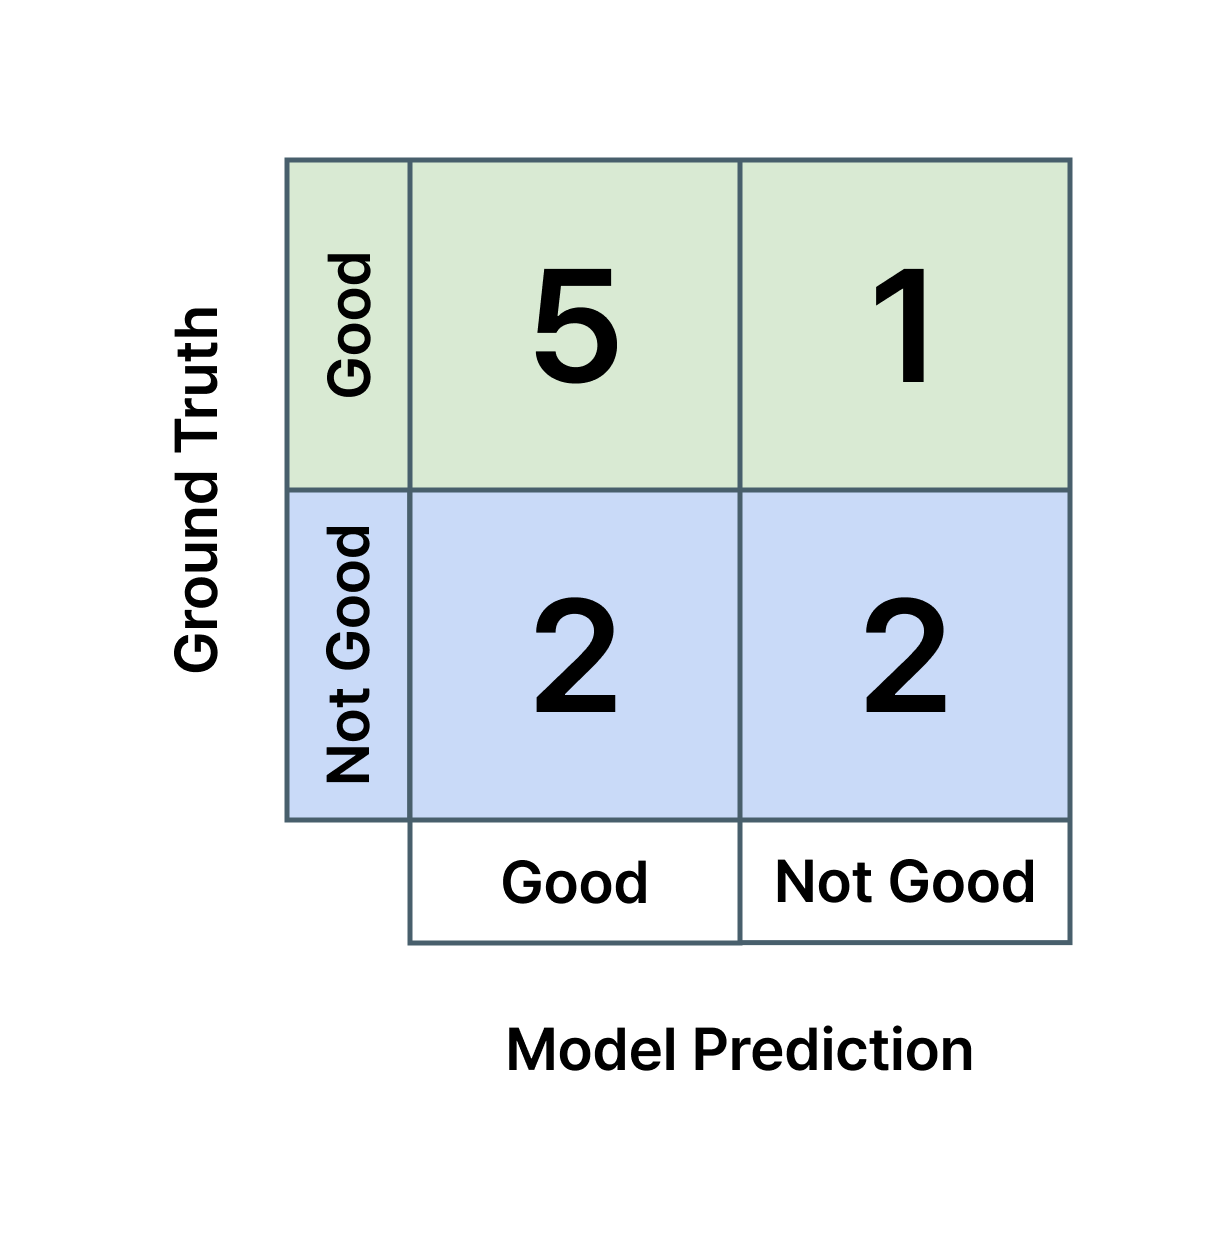
Out of 10 images, 6 are actually “Good.” The AI model correctly predicts 5 but misclassifies 1 as “Not Good.”
Out of 10 images, 4 are actually “Good.” The AI model correctly predicts 2 but misclassifies 2 as “Not Good.”
… In these scenarios, the Confusion Matrix will appear as follows:
Or, for another example:
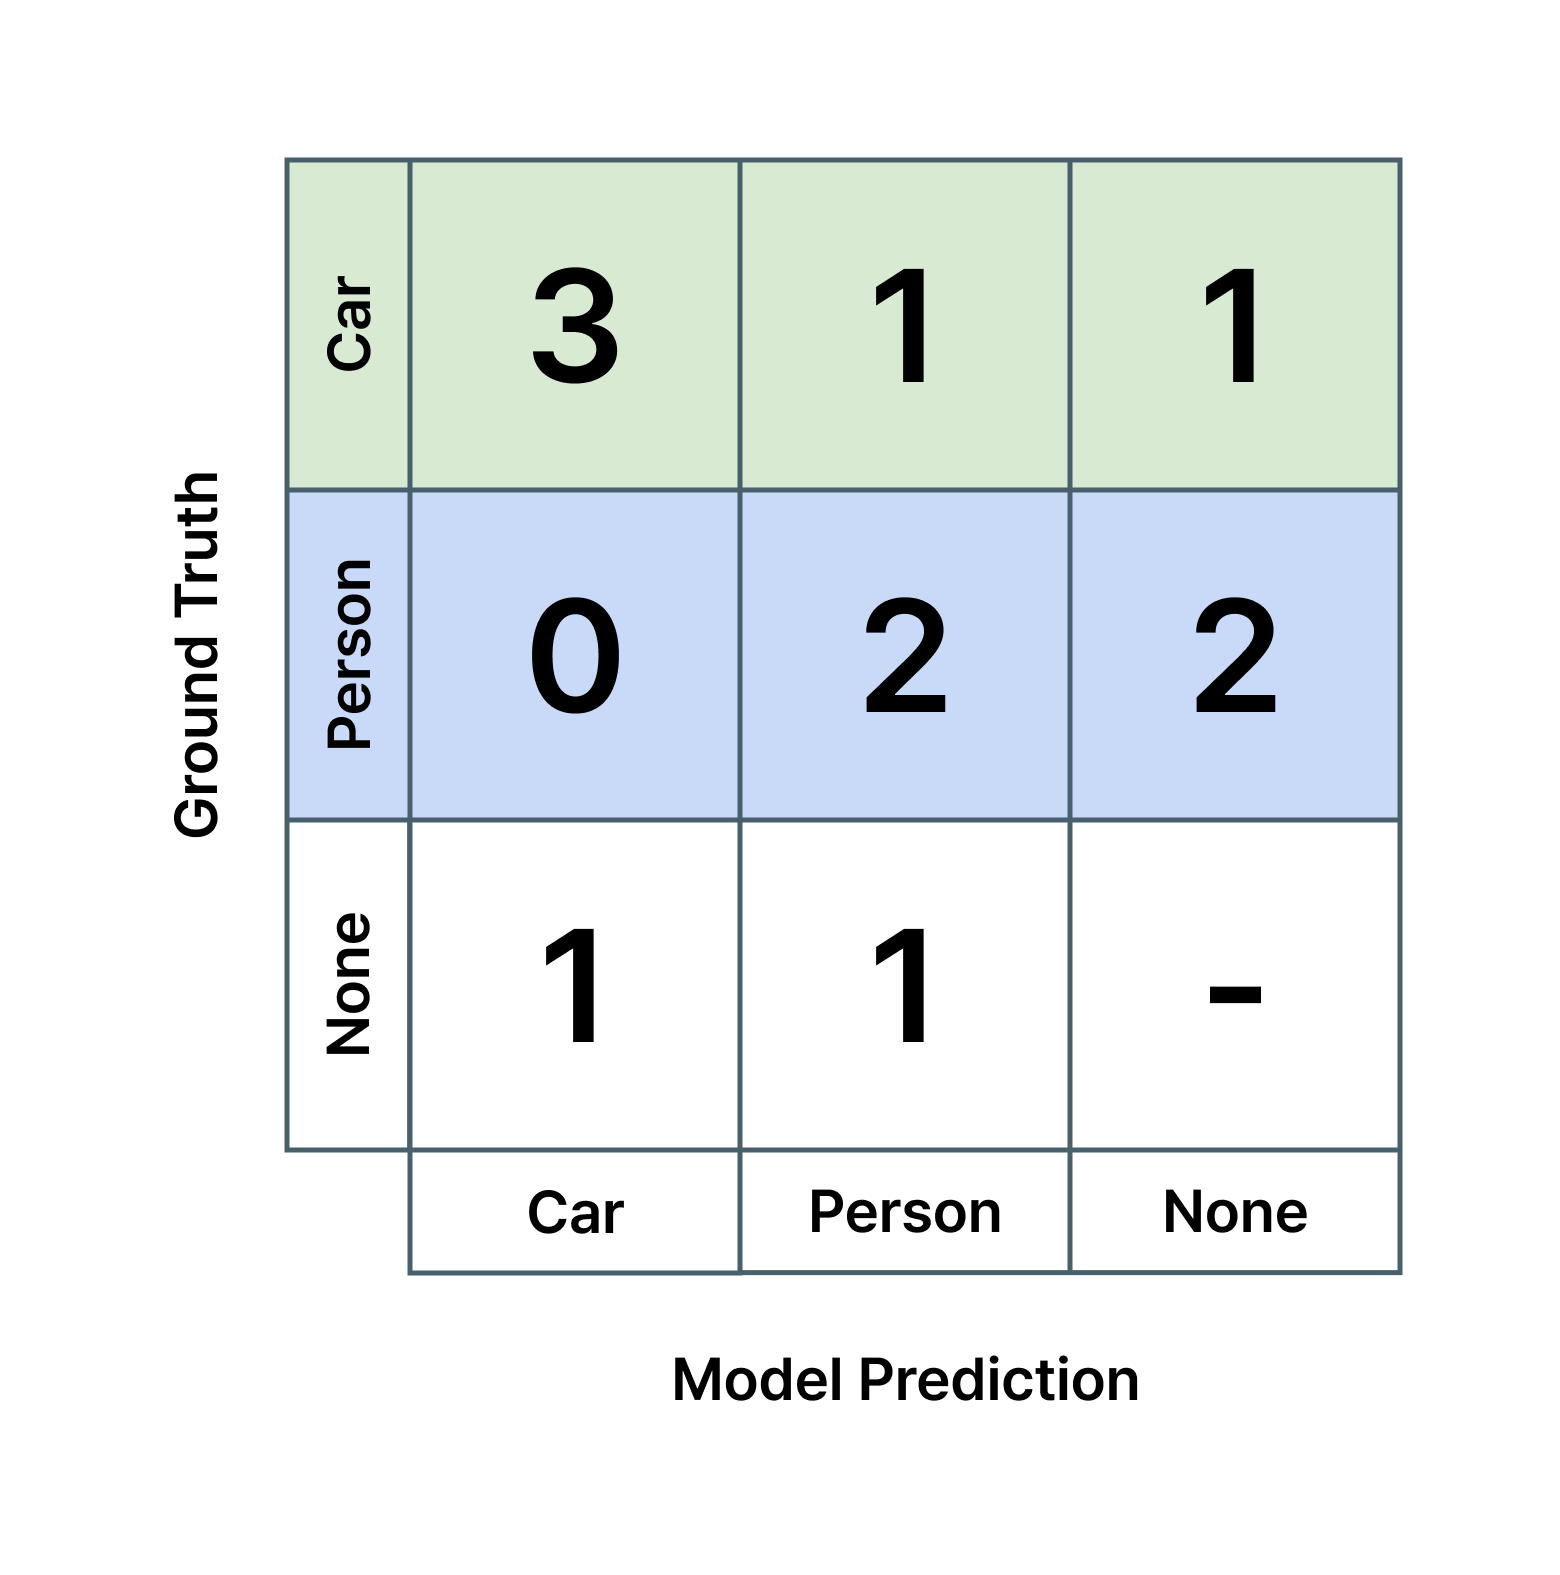
If out of many images, a car is present 5 times and the AI model correctly identifies it 3 times, mistakes it for a person once, and misses it once,
If a person is present 4 times and the AI model correctly identifies them twice but misses twice,
Or if the model erroneously predicts a car and a person in specific locations once each,
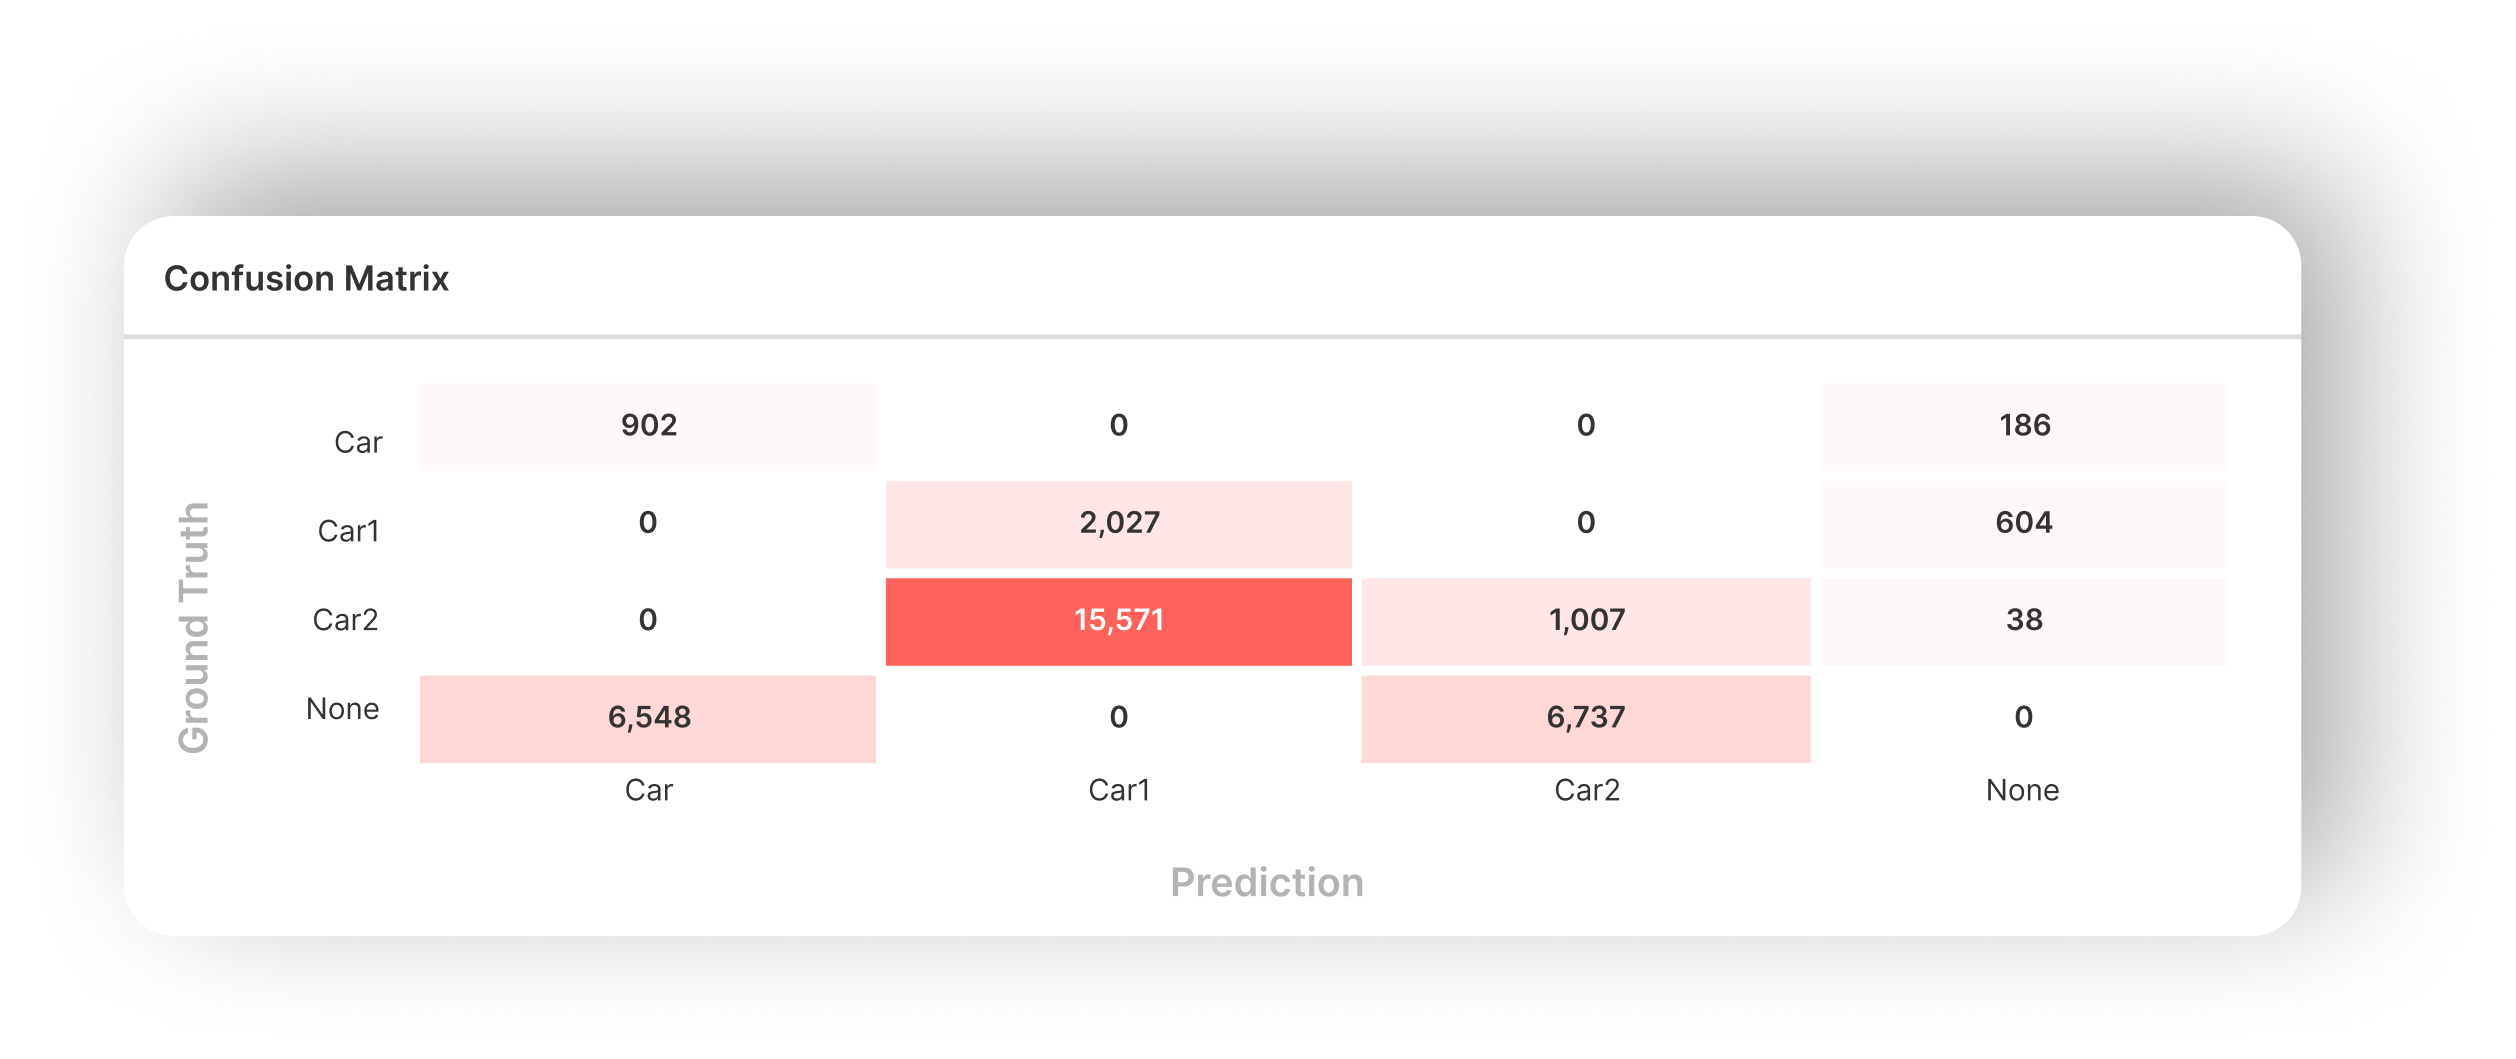
… Then the Confusion Matrix would be:
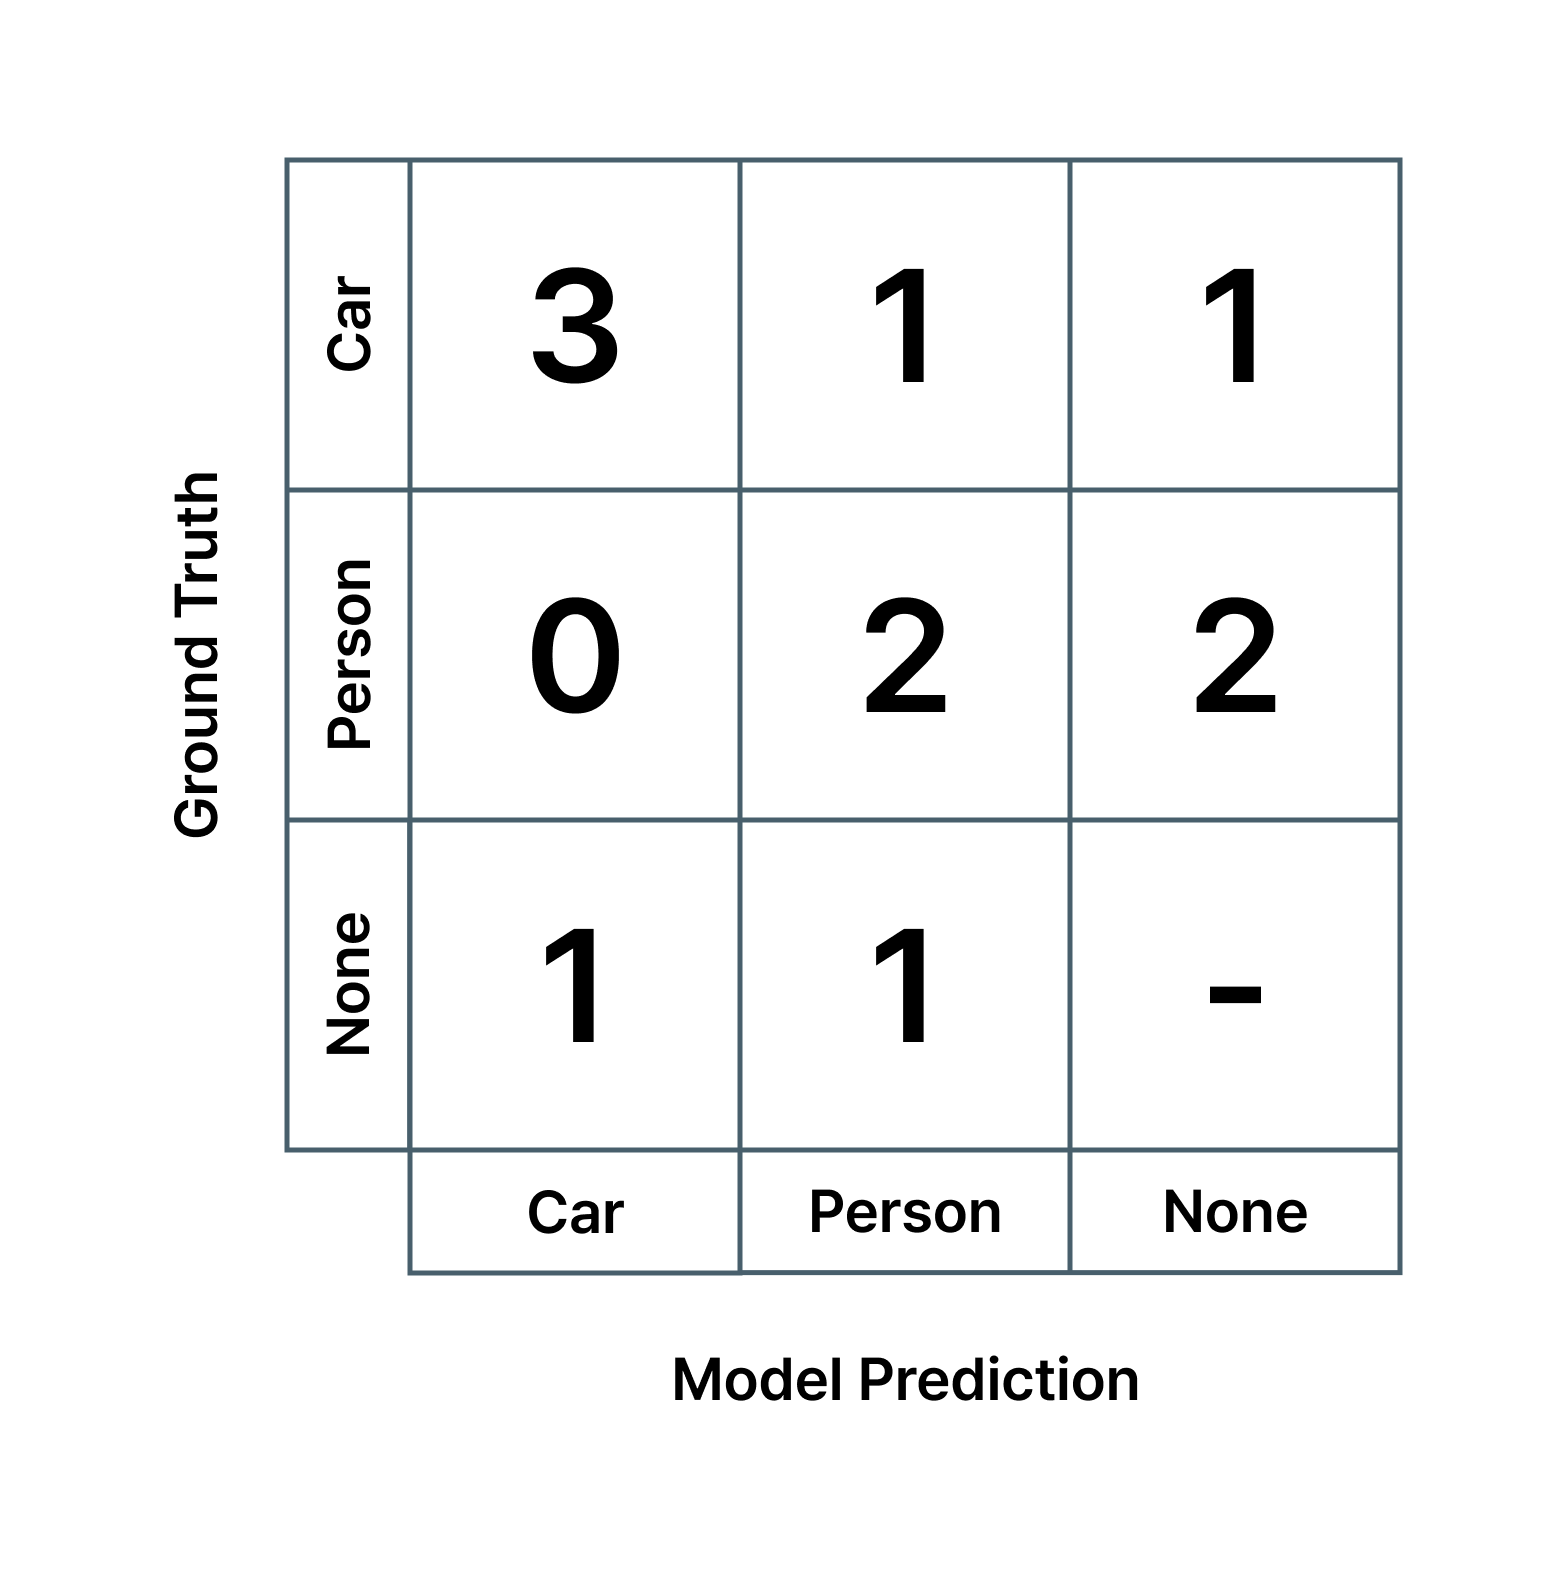
(Note: This includes instances where the model outputs nothing or a corresponding Ground Truth label is absent, hence a “None” class is added for both GT and Model Prediction.)
The Confusion Matrix enables users to assess general model accuracy and its performance across classes.
For instance, values along the top-left to bottom-right diagonal represent the “True Positives,” which means that the model-predicted classes match the actual Ground Truth classes. Higher numbers here indicate better model performance, whereas other values highlight potential confusion areas for the model.
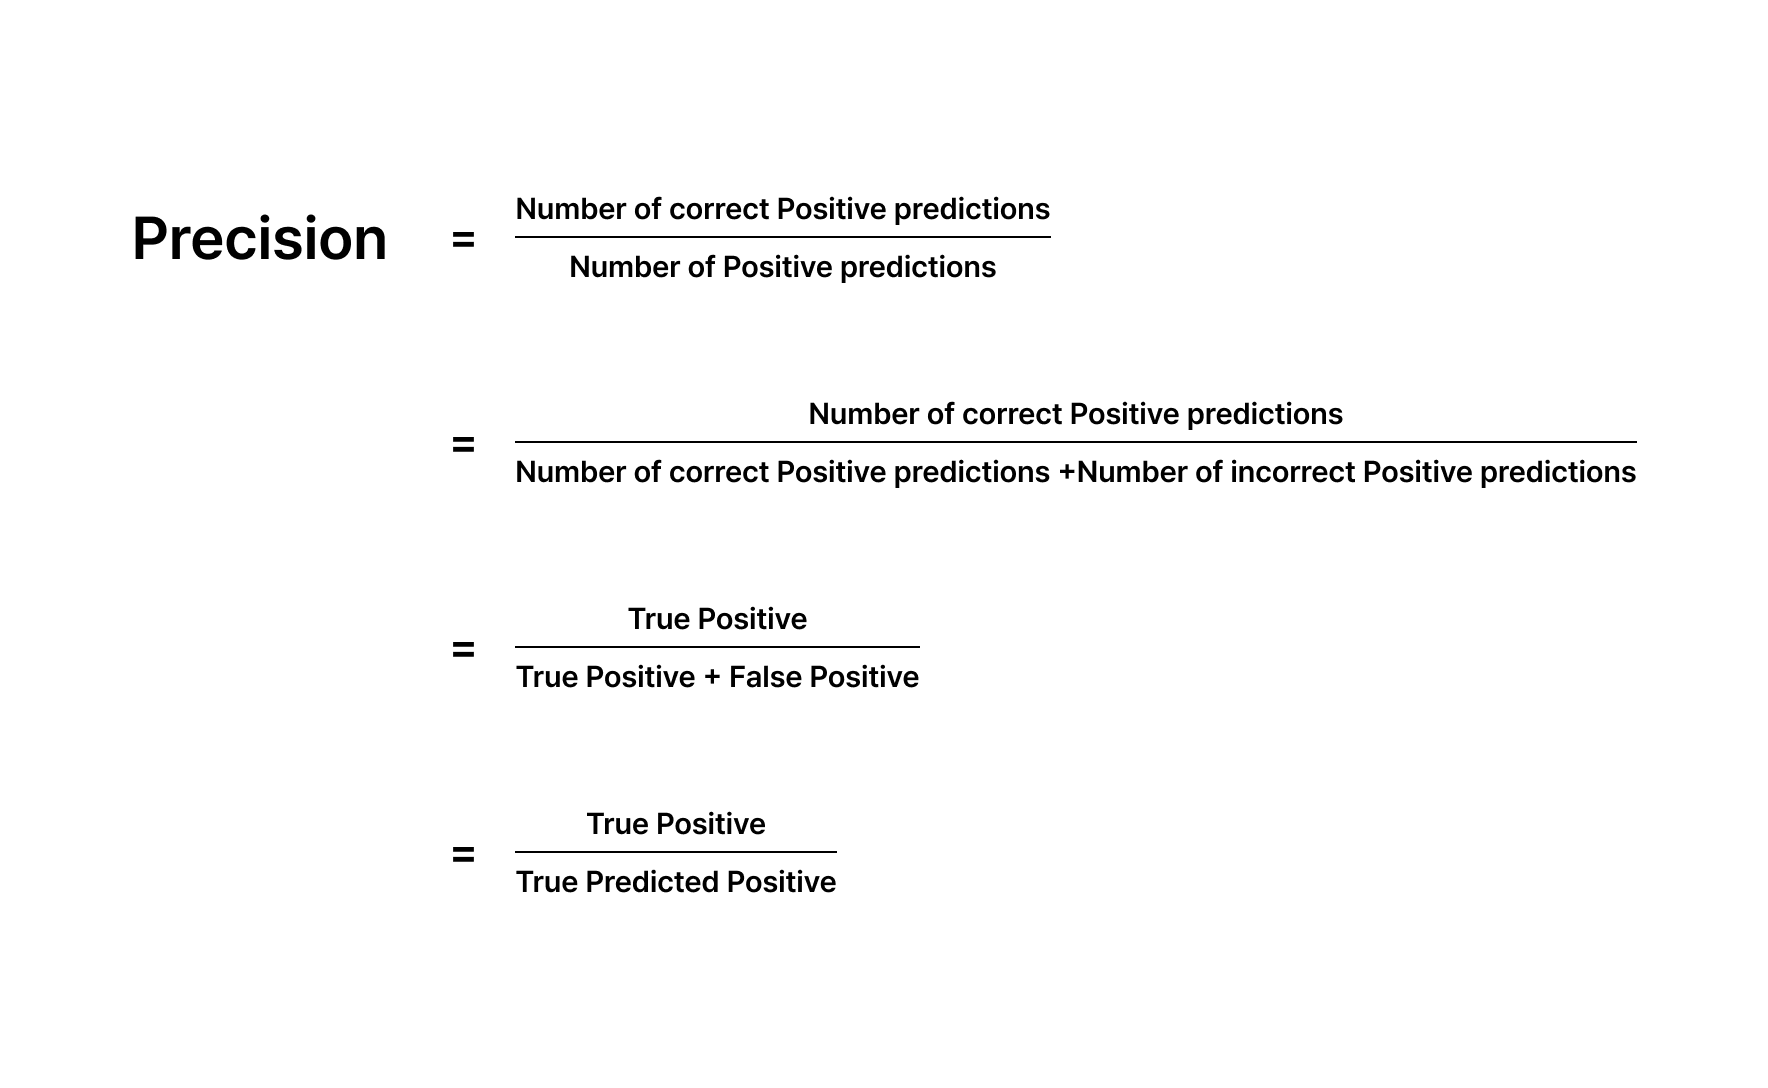
Precision
Precision is the proportion of correct predictions where the model-predicted classes align with the actual Ground Truth. For example, if a classification model in a factory has a Confusion Matrix as follows, the Precision for “Good” is calculated as 5/(5+2) = 0.71, and for “Not Good” as 2/(1+2) = 0.67, based on the figures in the green and blue columns respectively.
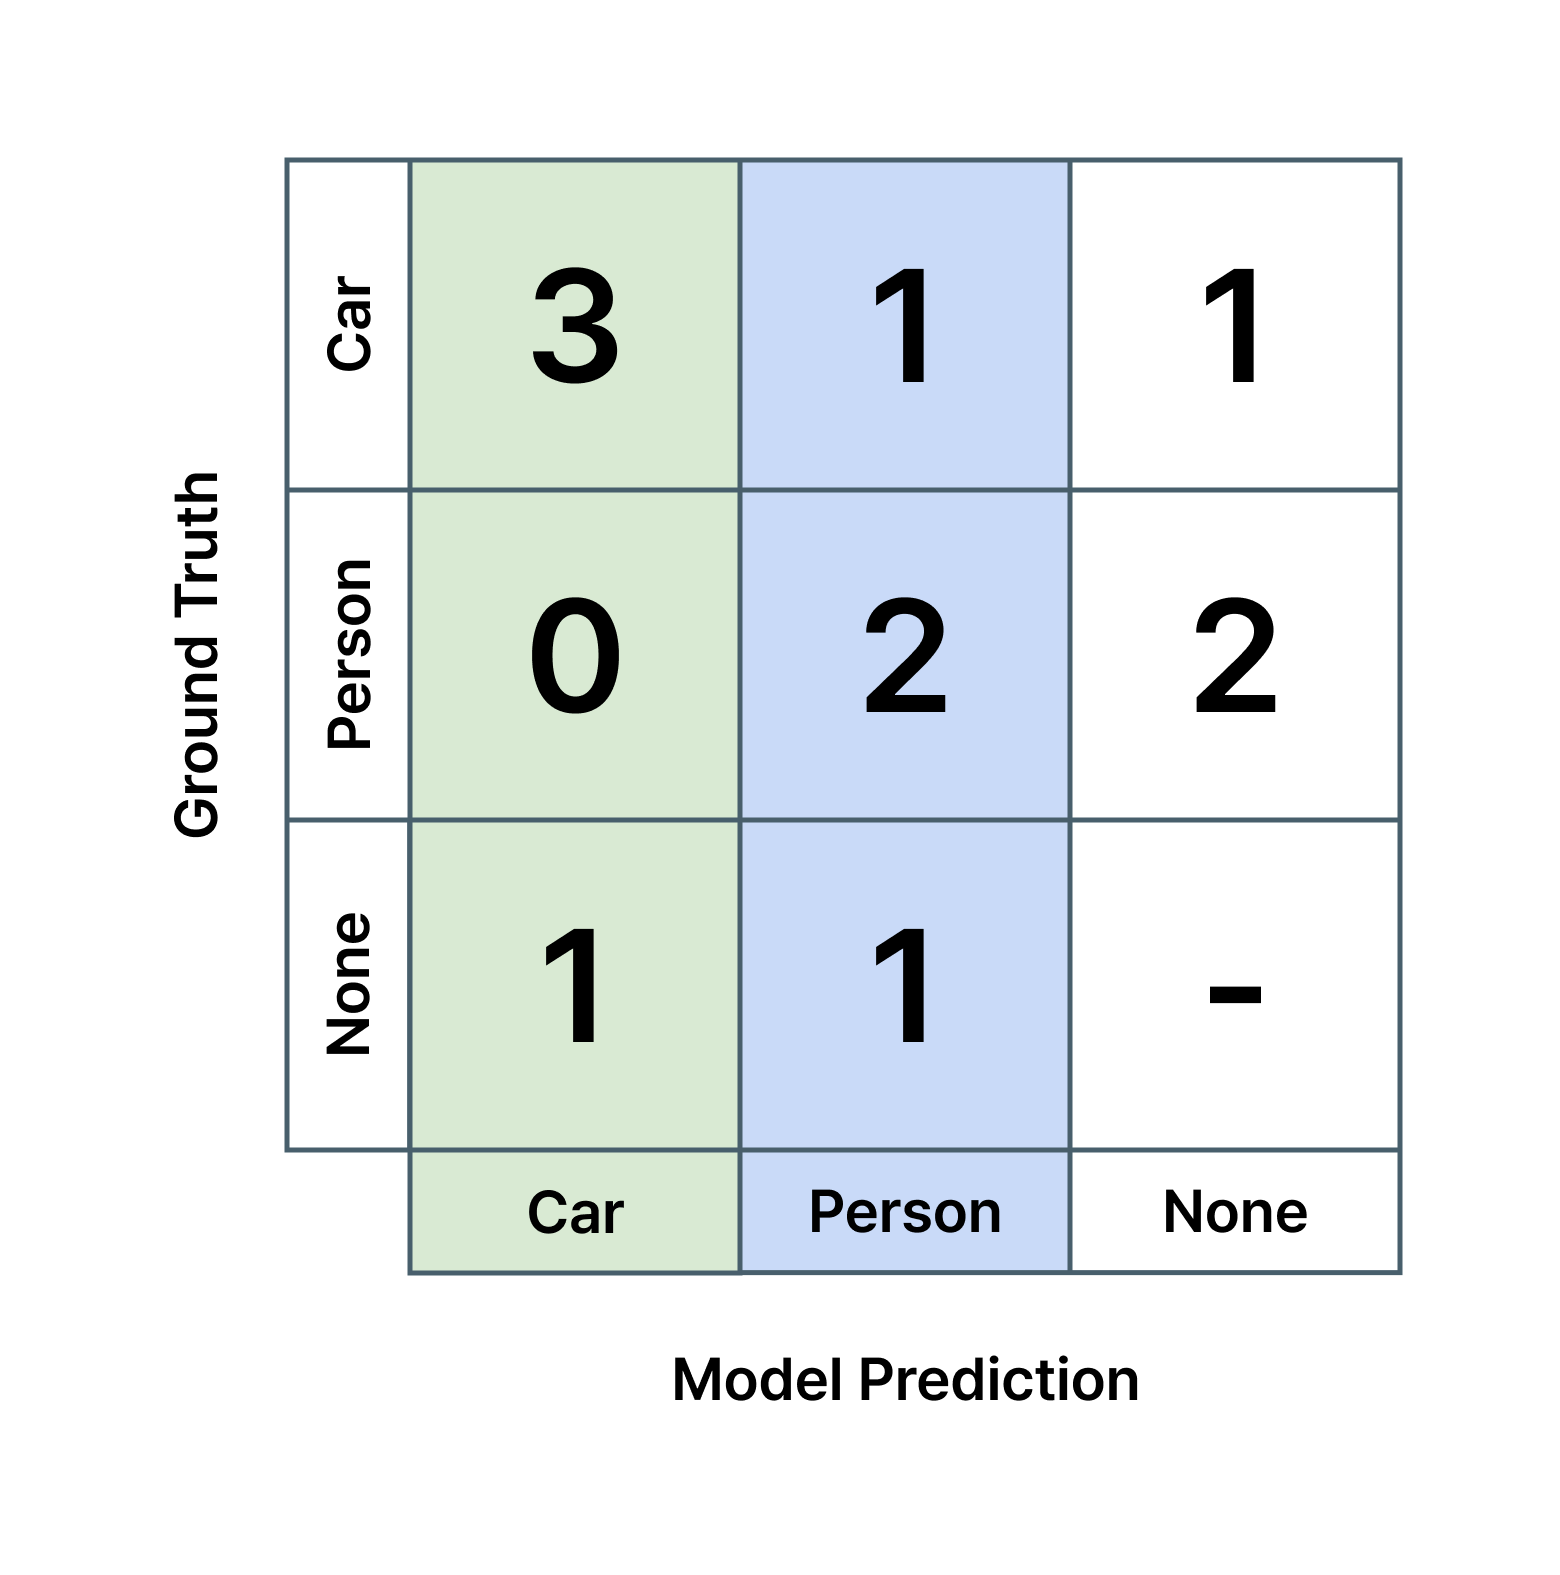
For a detection AI identifying cars and people in videos, Precision for “car” is 3/(3+0+1) = 0.75, and for “person” is 2/(1+2+1) = 0.5, indicating that only 75% and 50% of predictions for cars and people respectively were correct. These numbers indicate how “precise (consistent)” the model predictions are. Likewise with the previous example, Precision for “car” and “person” are calculated based on the figures in the green and blue columns respectively.
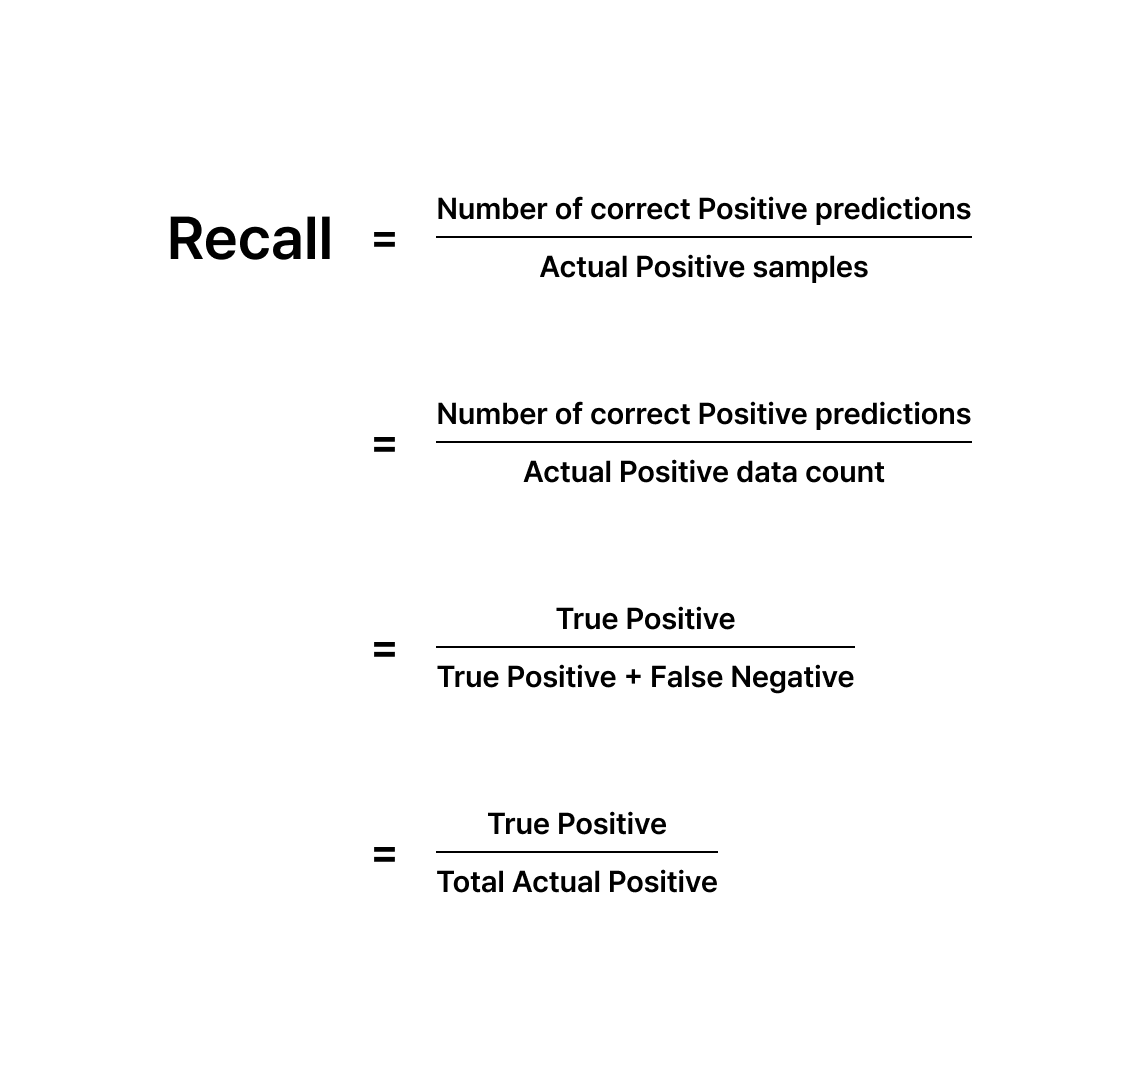
Recall
Recall is the proportion of actual Ground Truth classes that were correctly predicted by the model. For instance, if a classification model in a factory has a Confusion Matrix as shown, the Recall for “Good” is 5/(5+1) = 0.83, and for “Not Good” is 2/(2+2) = 0.5, calculated from the green and blue columns respectively.
For a detection AI with the Confusion Matrix below, the Recall for “car” would be 3/(3+1+2) = 0.5, and for “person” is 2/(0+2+2) = 0.5, meaning the AI accurately identified only half of the cars and people. Recall thus reflects the model’s ability to “recall” actual objects in its predictions. Likewise with the previous example, the Recall values are calculated based on the figures in the green and blue columns respectively.
Model Diagnosis Glossary
Understanding the terms "True," "False," "Positive," and "Negative" is crucial for in-depth analysis of your model's performance and prediction review.
“True”, “False”:
If you see only “True” or “False” without any additional words attached, it often indicates that the class names are “True” or “False”. For instance, if your model is classifying predictions into two classes, True and False, and it classifies a data point as “True”, this signifies that the model’s prediction for this data is “True.”
“Positive”, “Negative”:
“Positive” means that the AI model has output a certain value, while “Negative” means that it hasn’t.
"True Positive", “False Positive,” etc.:
There are four combinations of “True/False” and “Positive/Negative”: True Positive, False Positive, True Negative, and False Negative.
These terms help you determine if an output value that a model has generated (“Positive”) is accurate (matching the Ground Truth, thus a “True Positive”) or inaccurate (not matching the Ground Truth, thus a “False Positive”). Conversely, if the model generates no prediction (“Negative”), it can either be a “True Negative” (accurate non-detection in line with the Ground Truth) or a “False Negative” (inaccurate non-detection not in line with the Ground Truth).
For example, if an AI model detects a “human” at a specific location, and a human is indeed present in the data (the Ground Truth) as predicted, this is classified as a true positive. On the other hand, if the model detects a human at a specific location when there is none present in the Ground Truth data, this is a “False Positive,” or incorrect detection.
Similarly, if there is a “human” in a specific location within an image and the AI model fails to detect it, this is termed a “False Negative.”
For easier understanding, consider ‘positives’ and ‘negatives’ as to whether the model has generated an output or not, and ‘true’ and ‘false’ as to whether the prediction was accurate or not.
Let’s revisit the earlier example using the Confusion Matrix.
For a classification AI with the Confusion Matrix above, FP (False Positive) and FN (False Negative) for each class indicate the following:
False Positive for the “Good” class = The model inaccurately predicted a defect as a good product.
False Negative for the “Good” class = The model inaccurately predicted a good product as a defect.
False Positive for the “Not Good” class = The model inaccurately predicted a good product as a defect.
False Negative for the “Not Good” class = The model inaccurately predicted a defect as a good product.
Moreover, for an object detection model with the Confusion Matrix below:
A False Positive occurs when the model identifies an object where there is no corresponding label in the GT (Ground Truth is None).
A False Negative occurs when the model fails to detect an object at a location where one (or more) is indicated in the GT (Ground Truth is not None).
Additionally, False Positives and False Negatives can happen when an object is recognized in both the prediction and Ground Truth, but the classifications do not match:
If the actual object is a car but the model predicts it as a person, this means:
False Negative for the “Car” class,
False Positive for the “Person” class,
and the misclassification between the “Car” and “Person” classes.